Enhance your PI Vision Displays with ITI Group’s toolbox for easily building faster access to your high-value data
After listening to our clients, ITI Group has developed a suite of PI Vision Extensions aimed at streamlining your experience of PI Vision and tackling your most common frustrations.
Features such as improved display navigation, manual data entry, integration with other systems and an ever-growing library of symbols, come together in the subscription-based toolkit, PI VisionEx.
- Maximise value from your existing software
- Display data in new ways
- Create intuitive and interactive visualisations
- Understand your data faster
- Improve decision making
Supported by our team of certified PI Engineers, PI VisionEx has a managed roadmap of features which incorporates feedback and insights from our global customer-base. The subscription model ensures you will benefit from future releases of an evolving product with a large user-community, streamlining development costs and fast-tracking release of new features.
Current tools in a VisionEx subscription include:
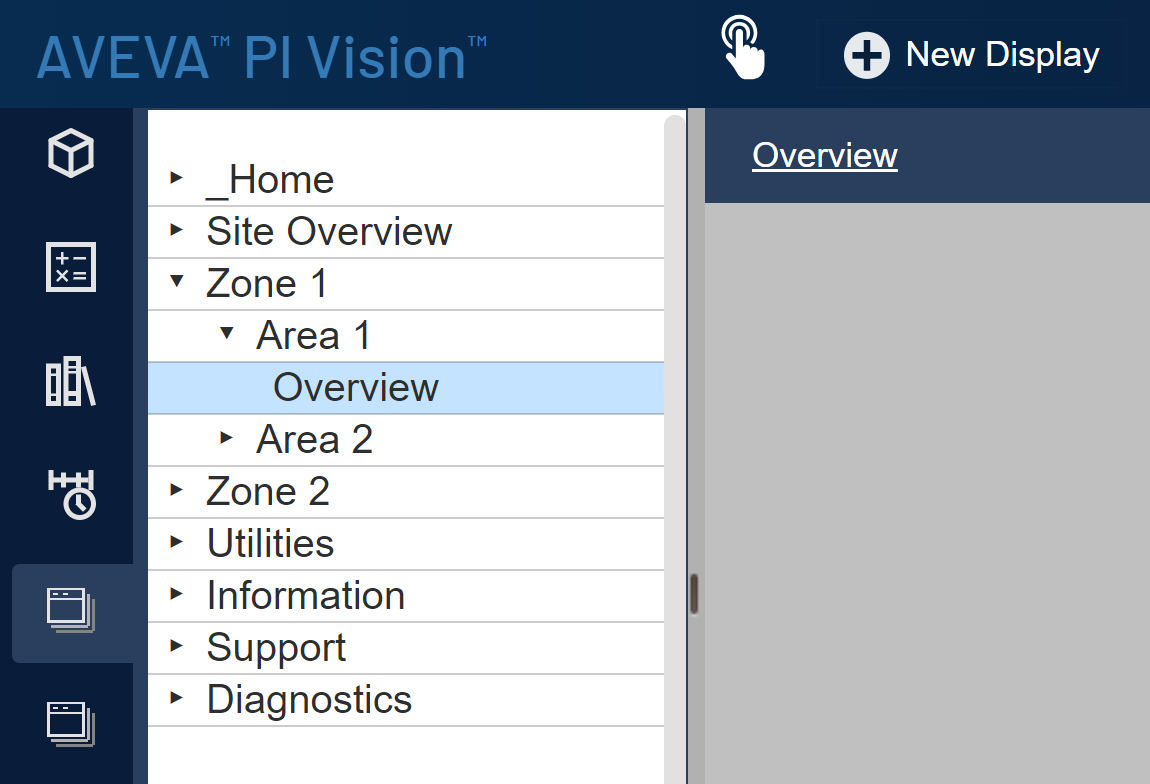
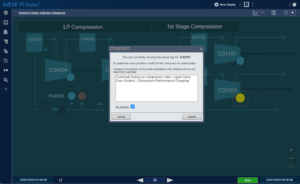
Streamline your navigation experience, with
Navigation Tool
- Navigate between displays using the tool pane.
- Move between similar displays without returning to the top menu.
- Reduce clicks to increase productivity and reduce user frustration.
For cohesion, the hierarchy is created from the PI Vision folder structure and leverages existing security policies.
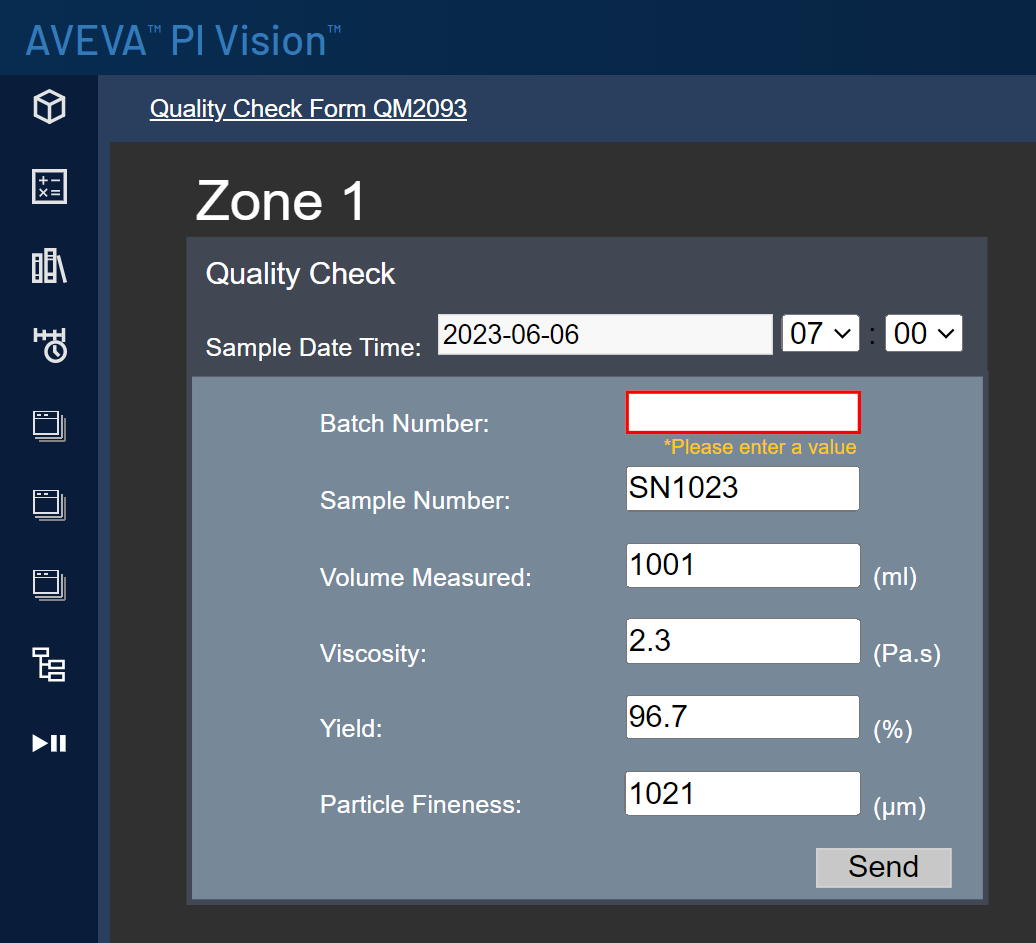
Manual Data Entry
- Update PI Tag values and AF attributes from a display.
- Create a wide range of user entry forms directly in PI Vision.
- Add data such as datetime, text, and numerical values, with optional validation.
- Reduce the need for alternative tools for user interaction.
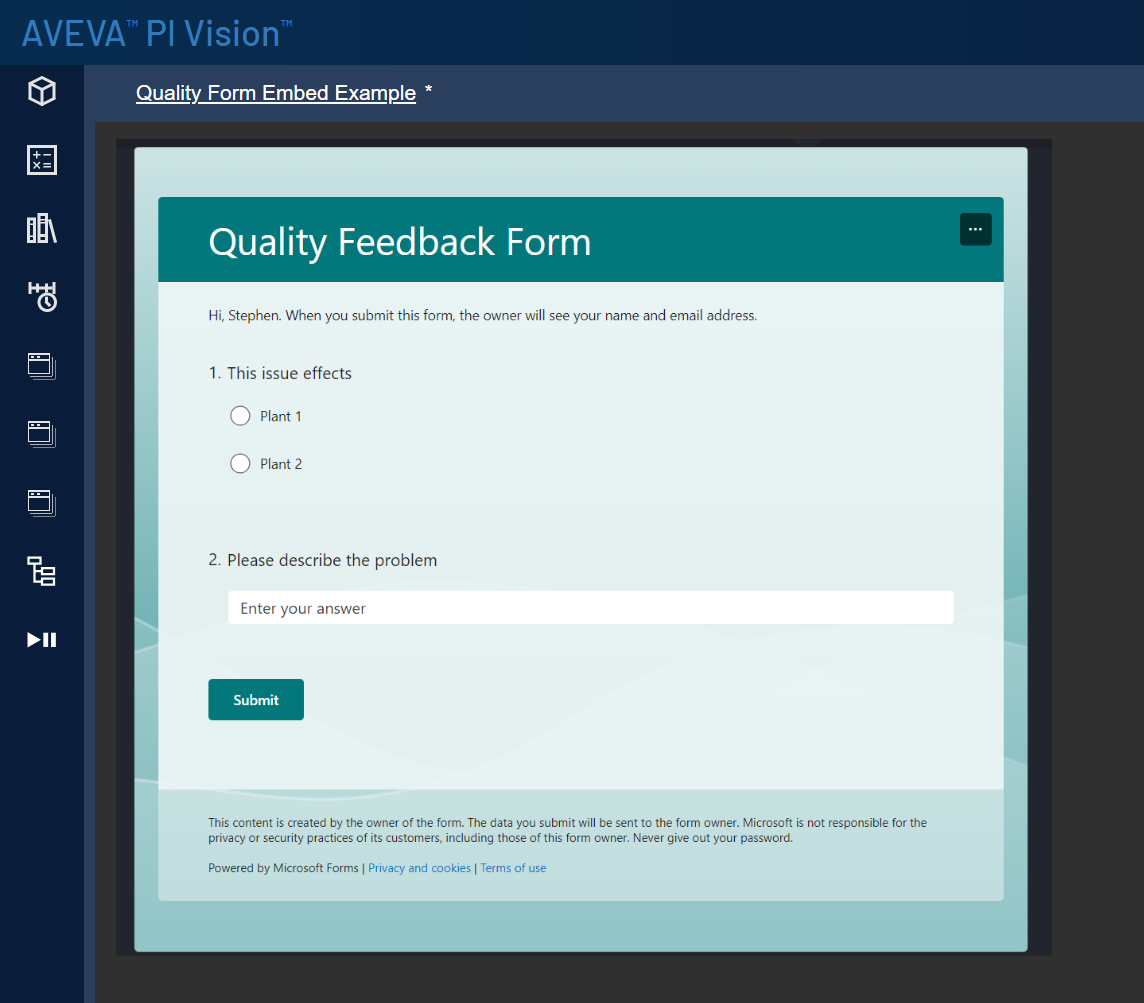
Web Page Embed
- Select a website to be displayed in a PI Vision dashboard, with option to refresh automatically.
- Integrate visuals, data and webcams from other systems (e.g. PowerBI, Office Forms etc.) to give a unified experience for users without having to navigate to other systems.
Status Indicator
- Develop real-time status indicators with manual data input.
- Monitor metrics such as availability.
- Capture user comments against known equipment issues.
- Build a history of metrics with comments that can be used for reporting or audit purposes.
- Understand availability losses and the most common causes.
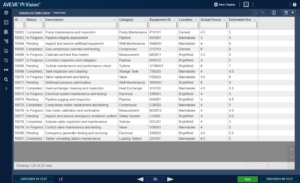
AF Table
- Present data from PI AF in an interactive table view.
- Incorporate other SQL Data through PI AF Linked Tables.
- Include advanced features such as sorting, filtering and paging of data.
- Provide a rich interactive experience for users.
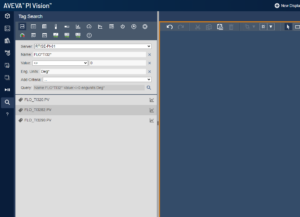
Advanced Tag Search
- Find PI tags easily by searching by point attributes.
- Quickly narrow down results by combining multiple search criteria.
- Focus on what matters by filtering out bad tags by quality and value.
- Select the correct tag by viewing additional point attributes in the search result.
More on the AVEVA PI System

Sign up to our PI System newsletter
"*" indicates required fields
View our Case Studies

Spirit Energy Digital Transformation
After just one year of collaborating with ITI Group on their Digital Transformation programme, Spirit Energy are already seeing the benefits of a properly managed data solution.
Repsol Sinopec Rotating Equipment
Through a collaborative approach, ITI helped Repsol Sinopec (previously Talisman Sinopec) achieve its ambitious “Rotating Equipment Excellence Programme”, which provides early warnings about potential equipment failures, collects and analyses historical data and enables future operational trends to